
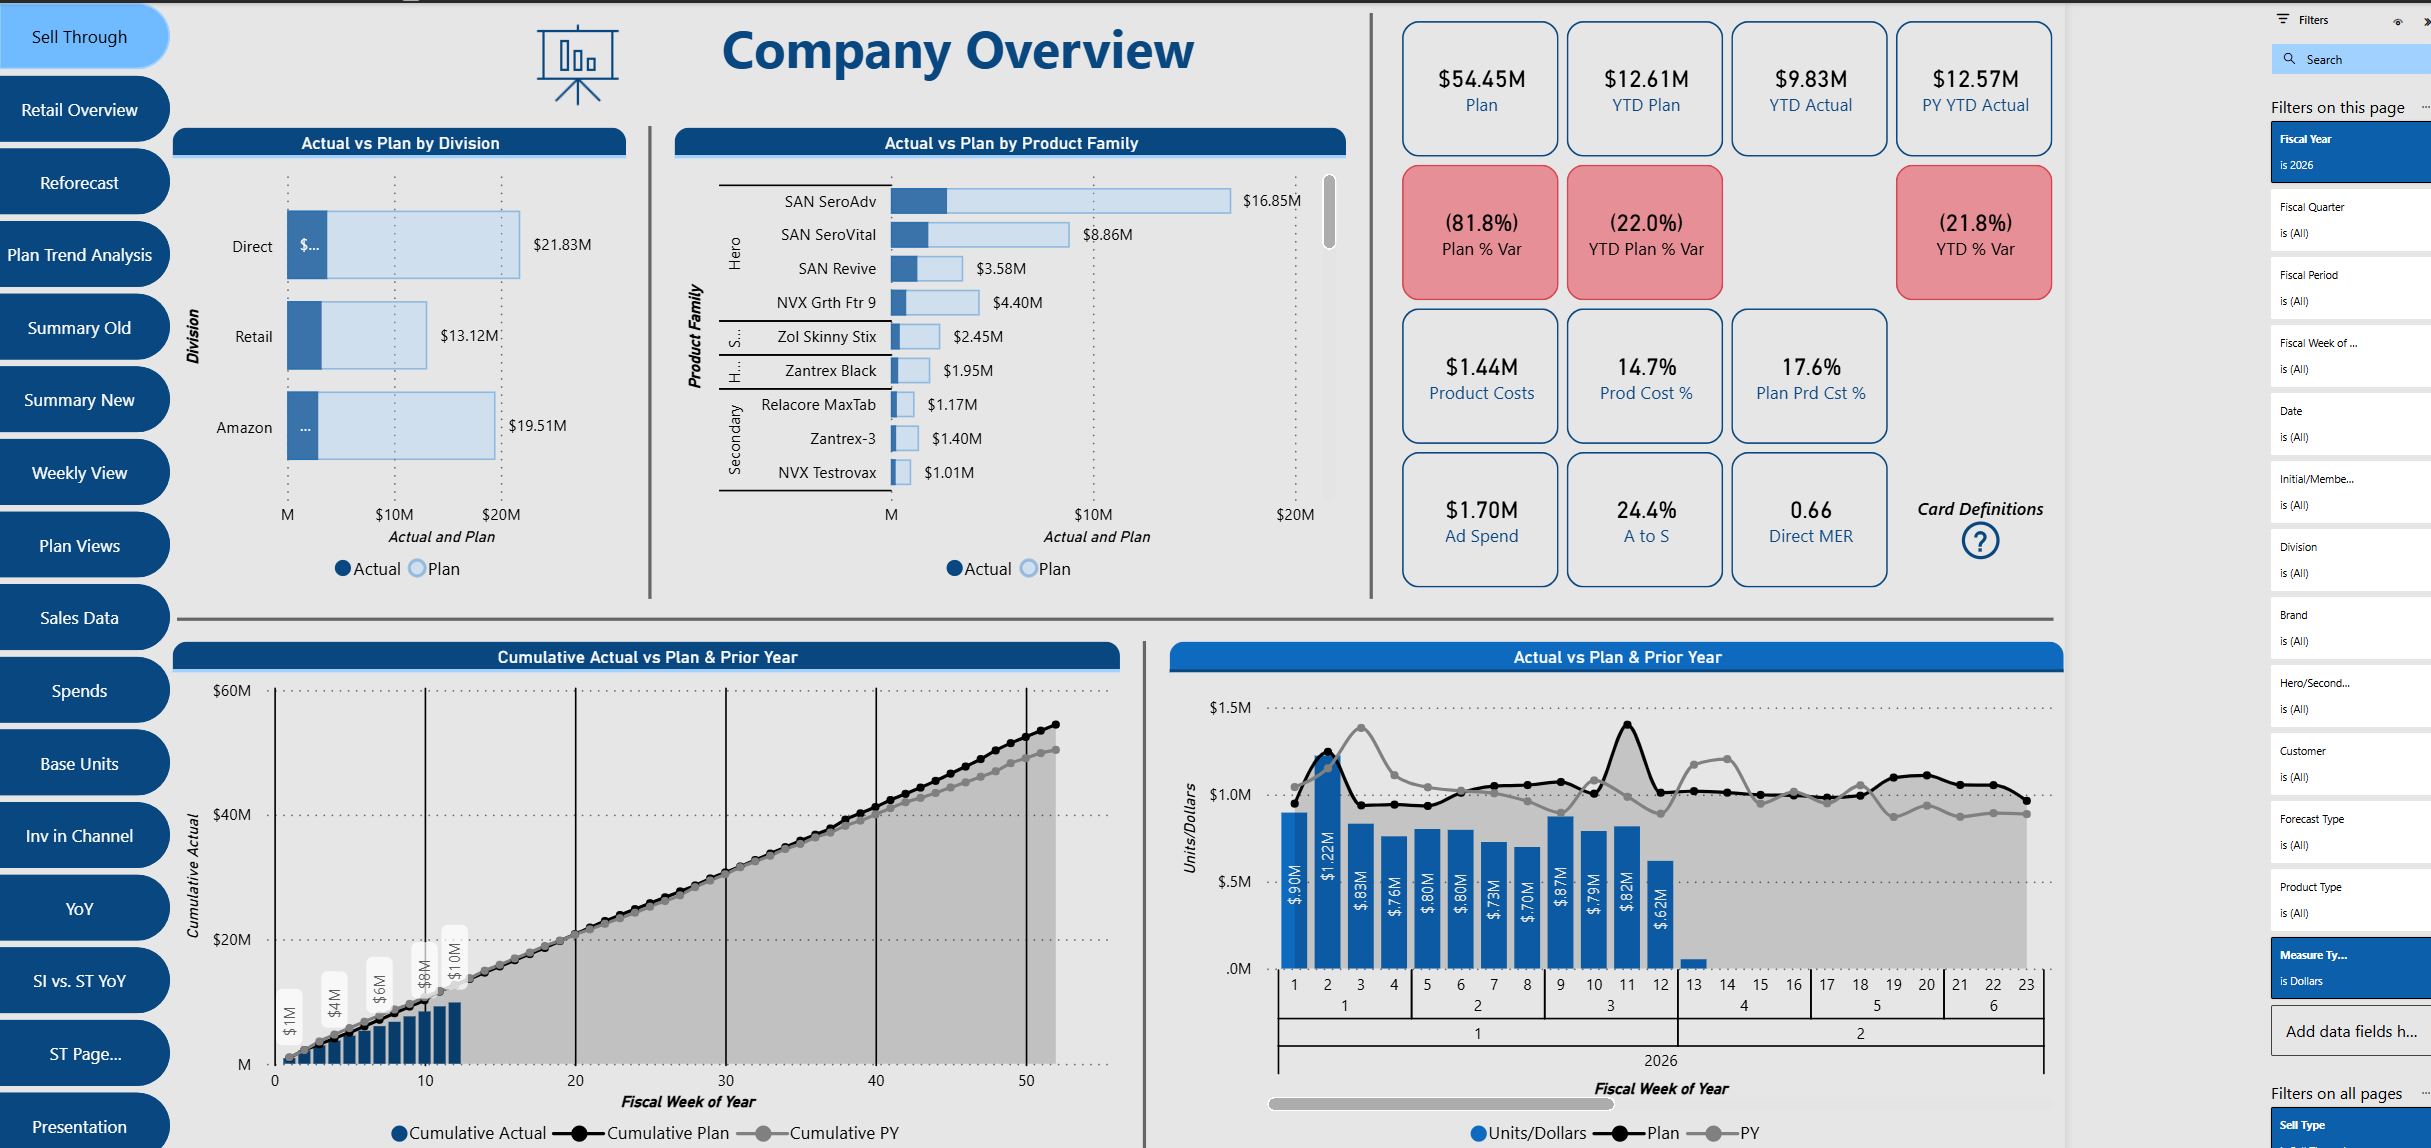
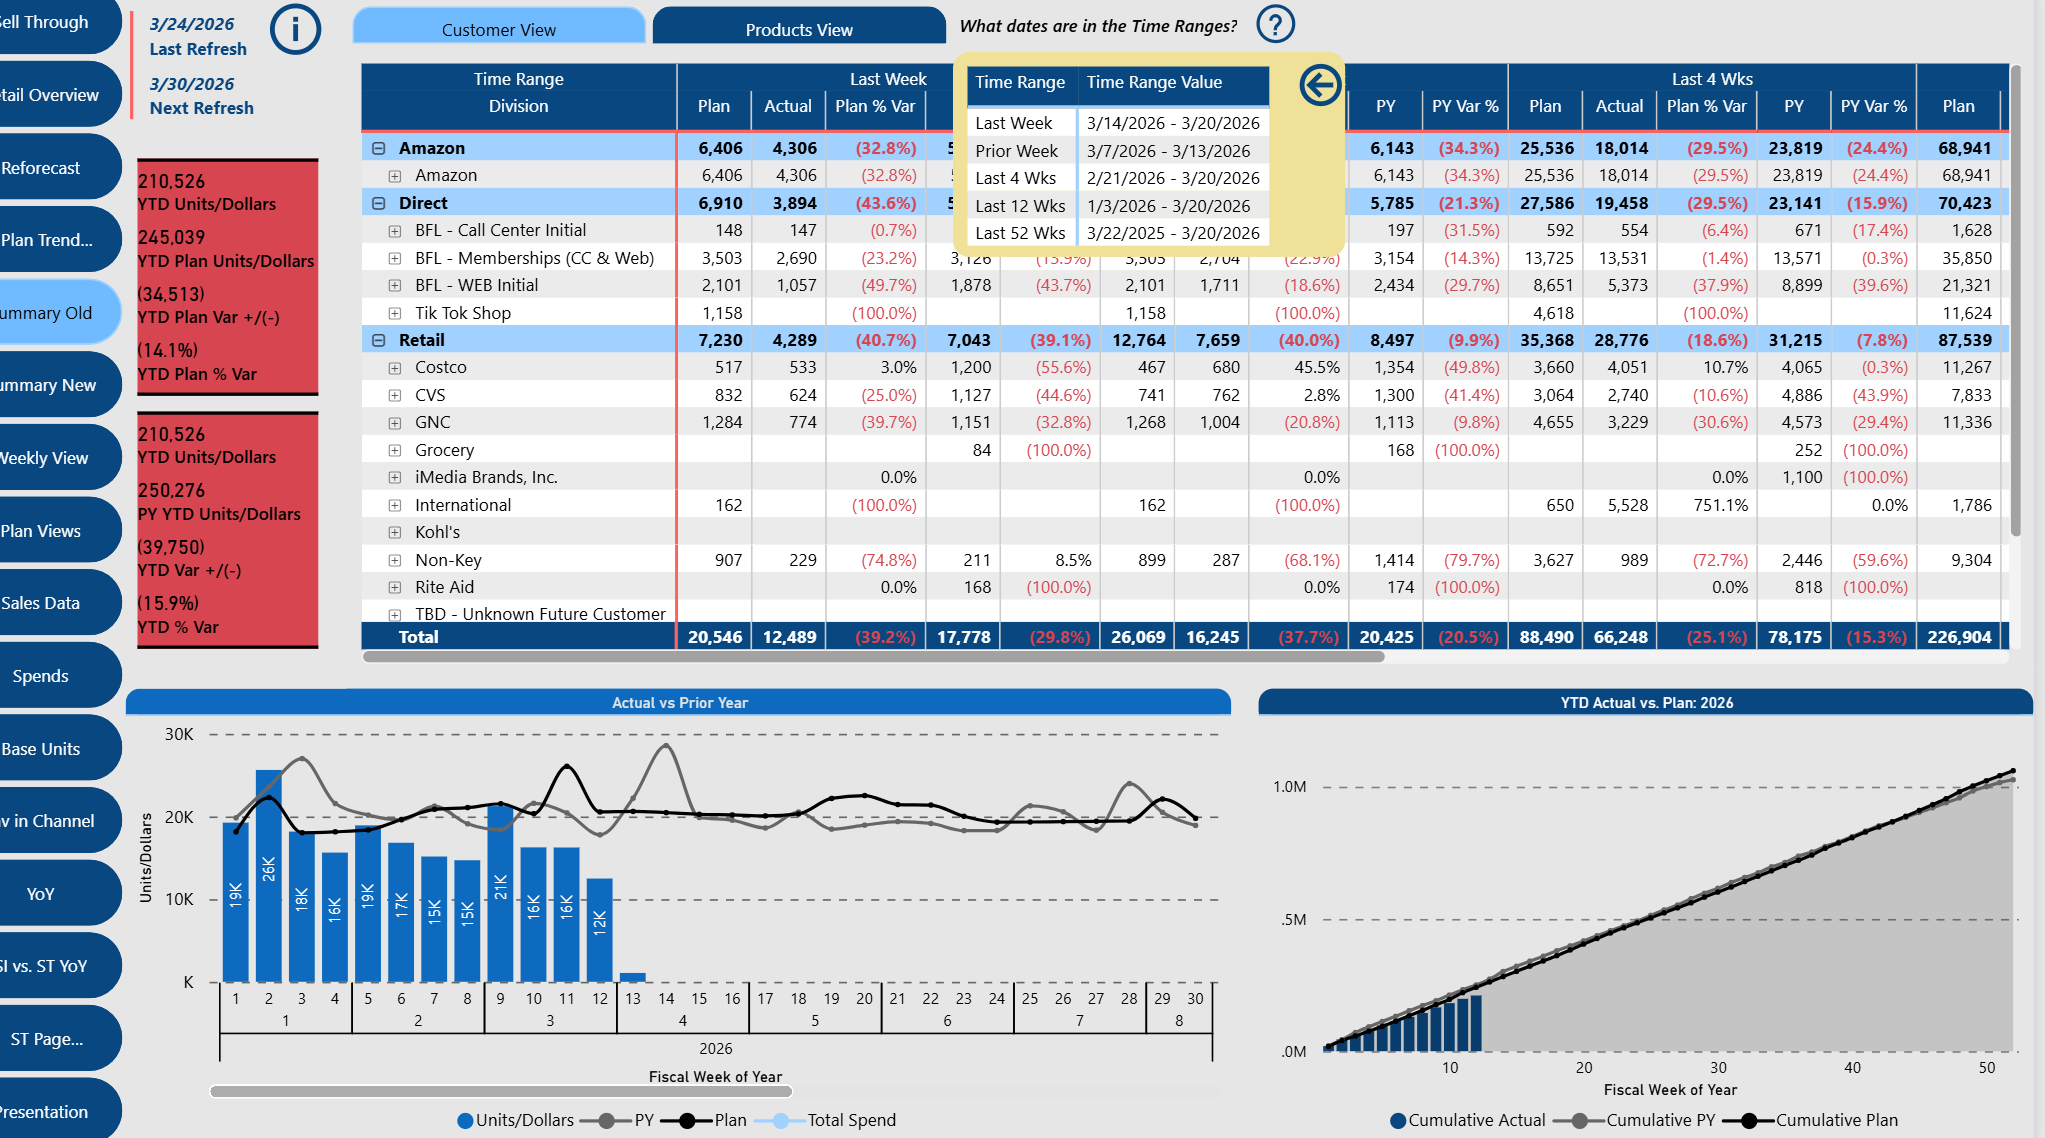
Dynamic coloring is used in the Sell Through built-in Dashboard to help identify if sales are up or down vs. Prior Year and Plan (left image).
Each page in the report is listed on the side panel of buttons for a more “App-like” experinece.
Time Intelligence calculations give quick insights into various metrics in the corresponding time frame (above image).
Dynamic filters can also help change which metric you look at: Units or Dollars (left image).